A significant component of genetics is how children inherit genes from their parents. If you recall my lectures, children do not inherit all the traits of their parents. Depending on whether the parents are homozygous or heterozygous, traits tend to skip generations.
While it sounds complicated to understand gene inheritance, geneticists use Punnett squares to determine how certain traits will be inherited. Depending on how many characteristics they consider, Punnett squares could be as simple as a 4×4 matrix or extremely complicated that they confuse even the best geneticists. Our online Punnett square calculator can generate punnett square in a single click. But if you wish to learn the basics of it and do it by hand. then this guide is for you, as we are going to explain the process of making punnett squares for a two-trait (dihybrid) cross.

Terms to Know Related to Punnett Square Calculation
Before calculating Punnett squares, a quick revision of important terms would help you understand the calculations better. These terms are already covered in my lectures, and here’s a quick revision so you can jog up the concepts.
- Punnett Squares: A Punnett square is a graphical representation used in genetics to predict the possible outcomes of a genetic cross between two individuals.
- Genetic Cross: A genetic cross refers to the mating or breeding between two individuals to produce offspring with specific combinations of genetic material.
- Monohybrid Cross: Monohybrid cross predicts the inheritance of a single trait.
- Dihybrid Cross: A dihybrid cross predicts the inheritance of two traits simultaneously. For a complete comparison difference between monohybrid cand dihybrid cross, read on here.
- Dominant Allele: Dominant allele is one of the alternative forms of a gene that, when present, masks or overrides the effect of the corresponding recessive allele.
- Recessive Allele: A recessive allele is an alternative form of a gene expressed as a trait only when both copies of the allele are recessive in a genotype.
- Homozygous Individuals: Homozygous individuals are individuals with identical alleles of a gene.
- Heterozygous individuals: Heterozygous individuals are individuals whose gene alleles are different.
- Genotype: The genotype refers to the genetic makeup of an organism.
- Phenotype: A phenotype is the observable and physical trait expression determined by an organism’s genetic makeup.
- Genotype/Phenotype Ratio: The genotype/phenotype ratio refers to the numerical relationship between the genotypes and corresponding phenotypes in a population or the offspring resulting from a genetic cross.
Calculating a Punnett Square For A Dihybrid Cross
To calculate a Punnett square for a dihybrid cross, we first need to identify what the genetic makeup of our parental generation is. For this example, we can consider traits A and B. Let’s assume that one of our parents is homozygous dominant for traits A and B while the other is homozygous recessive for both traits.
As such, the cross for the parental (P) generation would be AABB x aabb
The alleles they can transfer to their offspring will be AB for the first parent and ab for the other. Consequently, the first familial (F1) generation will express a genotype of AaBb.
Let’s understand a dihybrid cross of this heterozygous AaBb individual with another heterozygous individual to produce the second familial (F2) generation.
This cross can be expressed as AaBb x AaBb
We must now determine the allelic combinations each parent can transfer to their offspring. These combinations include AB, aB, Ab, and ab.
Next, we must determine how alleles from one parent combine with alleles from the other. As we deal with four possible allelic combinations interacting with four combinations from the other parent, we have sixteen ways these alleles can combine in the offspring! That is a lot of data to work around in your head, so we use a Punnett square to understand how these combinations can happen.
In a Punnett square, we write the possible alleles the first parent can give on one side of the table and the likely alleles the other parent can give on the other side. A typical Punnett square looks like this:
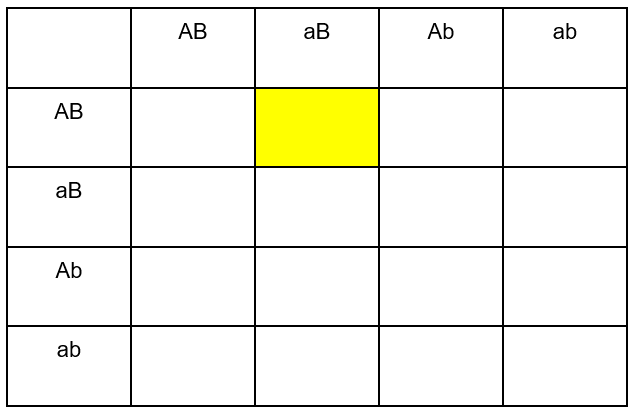
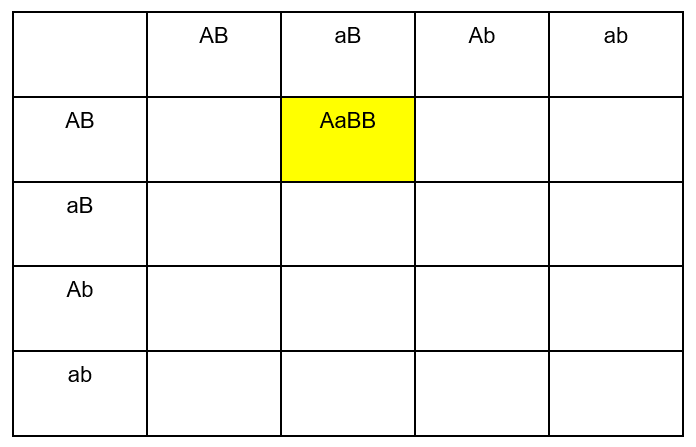
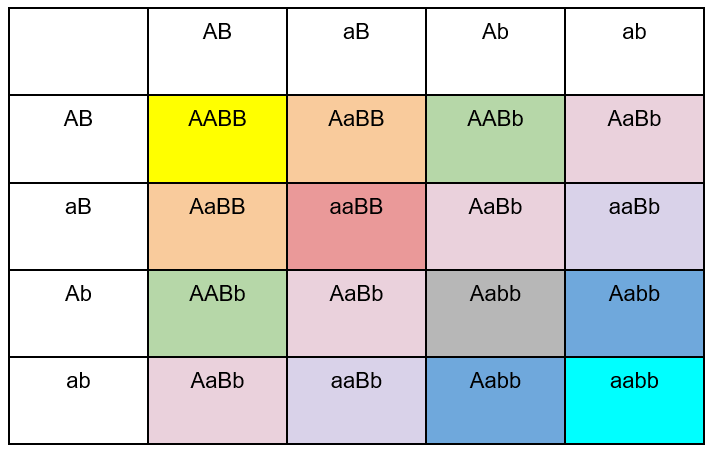
Next, in each corresponding cell, we combine the alleles given by the parents in that row and column. For example, the cell highlighted in yellow is in the row that represents the AB alleles, while its column represents the aB alleles.
We can fill it accordingly to:
Similarly, we can fill all the cells and complete our dihybrid cross worksheet. The completed table will look like this:
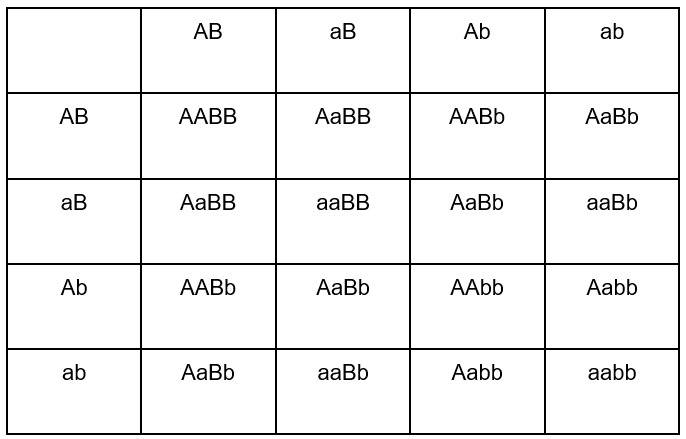
Congratulations! You have calculated the Punnett square for a di-hybrid cross!
Calculating the Genotypic and Phenotypic Ratios from a Dihybrid Punnett Square
Now that you have made it quite easily while you thought it is much tougher, we must interpret it to understand what genotypes and phenotypes the F2 generation expresses.
We know that any combinations that have AA or Aa traits express the dominant form of the A trait, while aa expresses the recessive form. Similarly, BB or Bb expresses the dominant form of the B trait, while bb expresses the recessive form.
Based on this, we have four distinct phenotypic possibilities, and we will highlight the cells showing each phenotype in a different color. The individual can express the dominant form of both genes, which we can highlight as yellow. They can express a dominant A but a recessive B, which we can highlight as green. They can also express a dominant B but a recessive A, which we can represent with blue. Lastly, they can have both A and B traits in their recessive form, which we can highlight as red.
Our completed table of ratios will look like this:
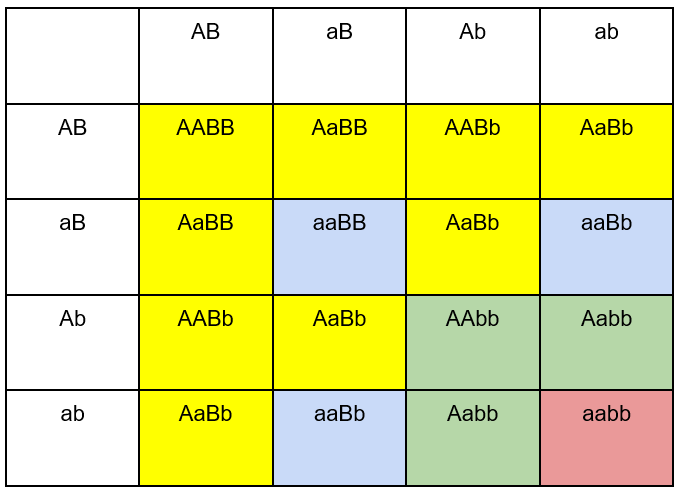
If we count the cells in our very colorful table chart, we get 9 yellow cells, 3 green cells, 3 blue cells, and 1 red cell. Hence, our phenotypic ratio is 9:3:3:1.
Calculating the genotypic ratio is more difficult as there are so many genotypes. Let’s color code our worksheet again:
Now, If we calculate the colored boxes, we get a genotypic ratio of 1:1:2:2:4:2:2:1:1.
Conclusion
Punnett squares are one of the best tools a geneticist has at their disposal. While they may sound daunting, they are actually very easy to construct!
A dihybrid cross involves 16 different genetic competitions, so genetics students often find it difficult. But through Punnet squares, it is very simple to calculate the outcome of a dihybrid cross!